
Have you ever wondered which dog breeds are more well-tempered than others? This is exactly the question that the American Temperament Testing Society (ATTS) set out to answer. The group recruits dogs from hundreds of breeds to participate in their 10-part test which “measures different aspects of temperament such as stability, shyness, aggressiveness, and friendliness as well as the dog’s instinct for protectiveness towards its handler and/or self-preservation in the face of a threat”. From all these data, the ATTS then publishes summary statistics as evidence towards the general behavior of each breed.
I’ve taken the raw data from the ATTS experiments and visualized them interactively on the right sidebottom of this page. You can sort dogs by various features (described below), search for individual dogs, and compare different breeds based on their observations. I made this tool both because I thought it might be useful for those curious about different dog breeds, and also because it might let the ATTS data shine brighter than how it was previously represented.
As laudable as the ATTS’s efforts are, their statistics – listed only as an HTML table of pass/fail rates – are at best difficult to read, and at worst misleading. Throughout this blog post we’ll look at some of the ways that such simple data reporting can be misinterpreted, then we’ll look at some tools to understand the data better, then we’ll take a look at the philosophical interpretations of those analyses.
First we’ll start by looking at two example data points – the lovable Miniature Longhaired Dachshund and the oft demonized American Pit Bull Terrier:
 Pit Bulls clearly have a lower temperament
test pass rate at 87.4%
Pit Bulls clearly have a lower temperament
test pass rate at 87.4%
compared to the Dachshund’s impressive 91.2%
If you skip past the first three values in both rows (the raw counts), you can see what appear to be the most important numbers – the percentages of passes on the temperament test for each breed. The direct and obvious conclusion is that Dachshunds have a higher pass rate than Pit Bulls and therefore have a better overall temperament. The misleading part of this, however, has to do with the fact that the data is relatively low-fidelity. Each dog only receives a single pass or fail, rather than say a score out of 10. Consequently, it takes a lot of data to get to a stable estimate of a breed’s true temperament score. The fewer samples that have been observed, the less likely the breed is to be accurately represented in the ATTS data. In the case of the two dogs shown above, there has been roughly 27x more data collected for the Pit Bulls than for the Dachshunds. Practically speaking, this means that while the Dachshunds appear to be the more well-tempered dog from the data, we can’t be nearly as confident about that value, since we haven’t observed that many examples of the breed. With the Pit Bulls, on the other hand, there are nearly a thousand samples, which give us a very accurate reading on what that breed is really like.
 What Pit Bulls are really like
Just knowing that there’s uncertainty in the Dachshunds’ data isn’t enough, it’s important to know how uncertain we are, and what the real pass rate likely would be if we had infinite data. This question is exactly the motivation for a class of tools that calculate a Binomial Proportion Confidence Interval. The general idea is that since you can’t ever know what the true pass/fail rate for a population is without testing all of them, the best you can do is to estimate it with a smaller sample. The estimate is always going to be a little wrong, but we can demonstrate how wrong it is by presenting it as a range of values, instead of a single guess. The way the confidence interval is usually given, is by describing the lowest and highest pass rates that will occur, say, 80% of the time. Another way to look at it is that with the data we’ve already observed, if we saw that same data 5 times, only 1 out of those 5 times would the real pass rate be outside the values reported as the 80% confidence interval. The narrower that interval is (the closer the lower and upper bounds are to each other) the more confident we are about the real pass rate.
To help explore this idea, and apply it to the dog temperate data from the ATTS we can visualize these intervals for each of the analyzed dogs. Moreover, since binomial proportion confidence intervals are parameterized by a confidence level, (i.e. the 80% value that’s responsible for controlling the probability of how often the interval contains the true pass rate), we can visualize the whole range of probable pass rates based on the confidence interval equations. See this curve for an example visualization:
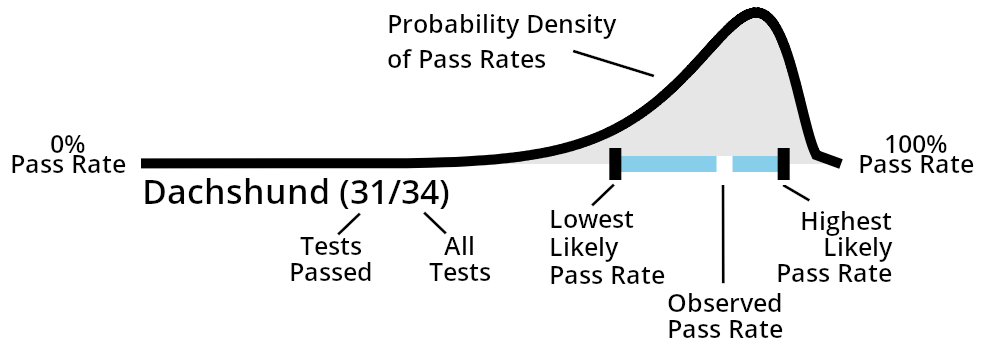 Components of Confidence Density Plot
This visual tool then let’s us explore differences between dog breeds in an entirely new way. If we go back to our example comparison between the Dachshund and the Pit Bull, we can now use these plots to (literally) see the differences in the data.
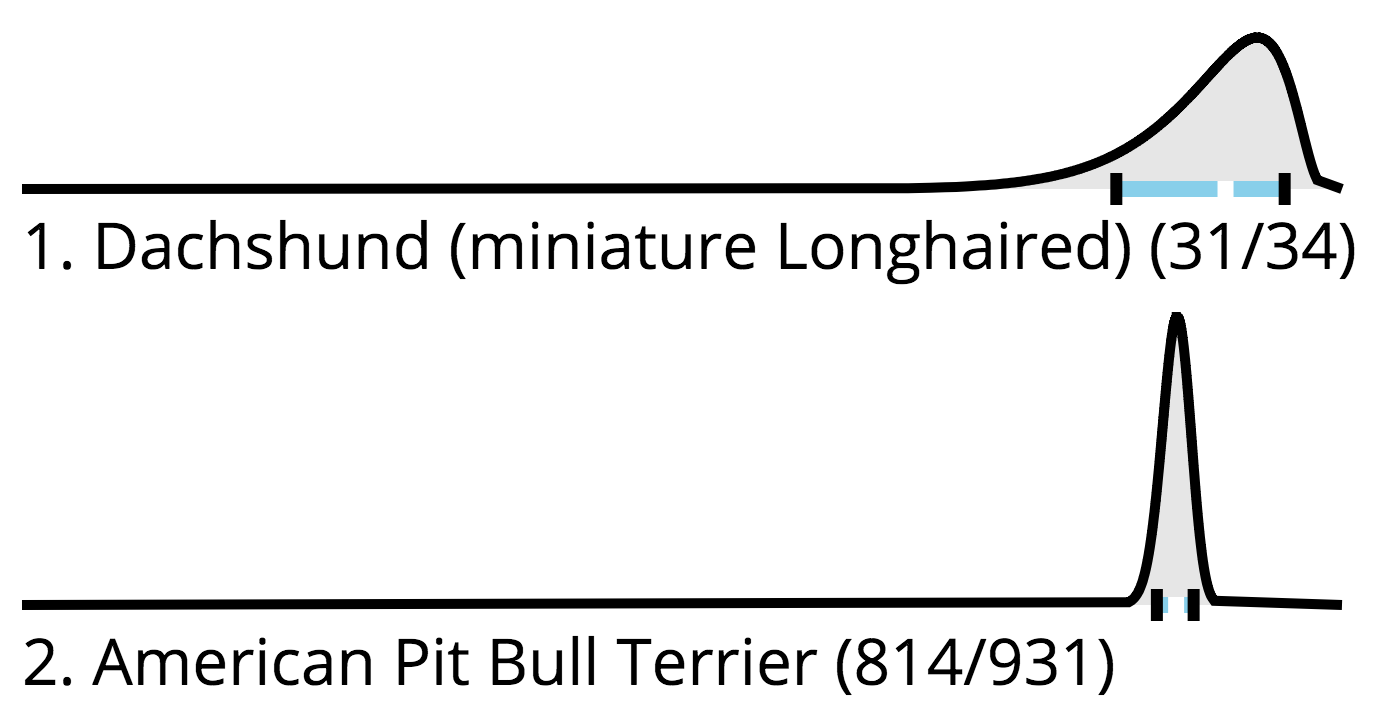 The Dachshund has a higher
upper-confidence-bound
The Dachshund has a higher
upper-confidence-bound
but the Pit Bull has a higher lower-confidence-bound
While the Dachshund does still have a higher observed pass rate than the Pit Bull, and it also has a higher upper-bound on it’s confidence interval, the Dachshund actually has a lower lower-bound. So, from this view, it appears that while often times the Dachshund has higher numbers, there are also occasions to prefer the Pit Bull. But, what does it mean to have a higher lower-confidence-bound, and when is that actually an advantage in the real world?
In addition to the mathematical definitions of high and low confidence bounds, there are also philosophical implications. As the values that mark the largest and smallest probable pass rate values (respectively), they mark the extremes you should consider when thinking about what good and bad outcome scenarios might look like. Philosophically, preferences between upper and lower bounds might correspond to feelings of optimism and pessimism, respectively. An upper confidence bound could be interpreted to mean “the scenario if we get reasonably lucky”, while the lower bound could be interpreted as “the scenario if we get reasonably unlucky”. So, when making a decision you might consider if you value more potential upside or potential (lack of) downside. If you look at dog like an investment into your own happiness, this concept is also quite related to risk tolerance. If you’re an adventurous single person looking for a fun play-pal, you might be more interested in a breed with a high upper-confidence-bound. If you’re a couple considering a dog to precede a baby, you be might interested in avoiding a breed with a low lower-confidence-bound.
In the case of our comparison between the Dachshund and the Pit Bull, the Dachshund might be for the optimist, the person who values the higher probability of a pass rate. The Pit Bull on the other hand is less likely to have a low pass rate, which is important for the pessimist who is more concerned with avoiding a low value. Another way to look at this is that the Pit Bull is the safer bet. They are less likely (as a breed) to be stellar, but also less likely to be terrible.
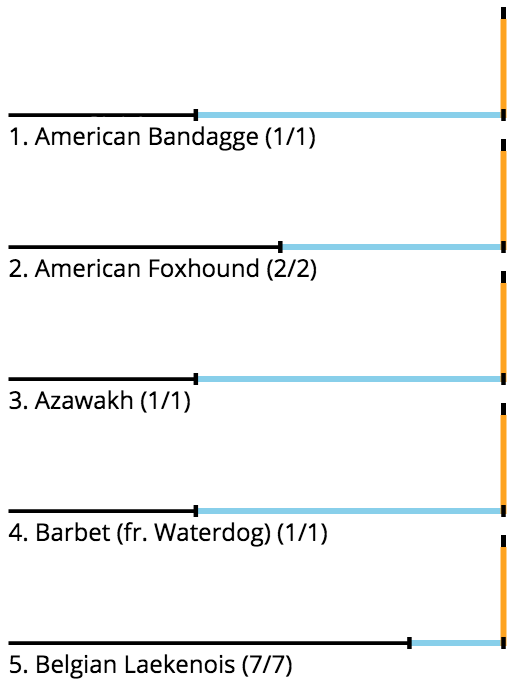
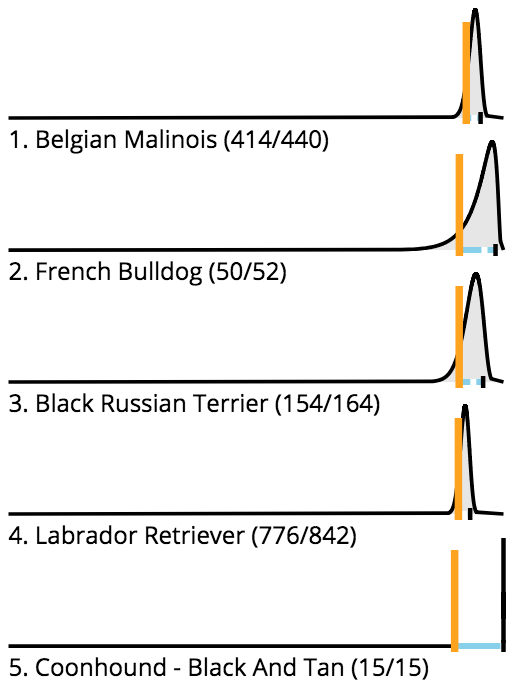
The value of the lower-bound becomes even more apparent when we look at the highest-ranked dog breeds sorted by each of the different metrics.
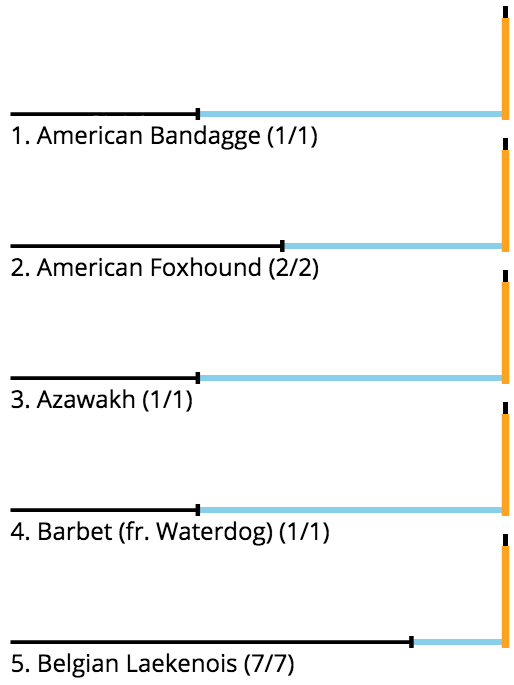 Top 5 breeds
by upper bound
 Top 5 breeds
by observed rate
 Top 5 breeds
by lower bound
When considering only the highest possible upper bounds or observed values, any breed which has never failed a test will automatically have a 100% pass rate. This is true even for breeds which have only had a single test. In fact, when looking at the top 5 results when sorting by both upper bound and observed rate, the median breed has only had a single test. When sorting by lower-bound, on the other hand, the median breed has had 164 tests, and the pass rate is closer to 94%. Still, the odds are that a highly rated breed with hundreds of observations is more reliable than a breed with only a single pass.
The tool on the right sidebottom of this page allows you to search for various
breeds of dog (using regular expressions if you like), and compare their
confidence density plots. Multiple breeds can be added with the + button, and
then removed with the -. If you would like to adjust parameters such as sort
parameter, confidence level, and bound filters, you can click the “Show Advanced
Options” button below the search box.
I want to emphasize, however, that these PDFs and confidence bounds describe statistical properties of the pass the rate (which is itself an average over dogs of a breed) not the variation in the breed itself. Even if the true pass rate were known exactly, there would still be variation among the individual dogs of that breed. For this reason, the numbers and plots in this post should be considered only as small piece of the puzzle. Dog breeds are complex, and every dog is different, but all breeds and especially all dogs deserve a chance.